Process Management: PROCESS ISSUE IDENTIFICATION TOOLS

Some Process Issue Identification Tools
Fishbone Diagram
A cause and effect diagram, also known as a fishbone diagram or Ishikawa diagram, was developed bu Kaoru Ishikawa in 1943. This is a method for diagramming the flow of work in a way useful for determing the cause and effects of problems encountered. The "head" is the identified problem. The body shows potential causes and is categoriezed into major categories. The major categories typically utilized include:
- Methods, Machines, Materials, Manpower, Measurement, Management
- Place, Procedure, People, Policies
- Surroundings, Suppliers, Systems, Skills
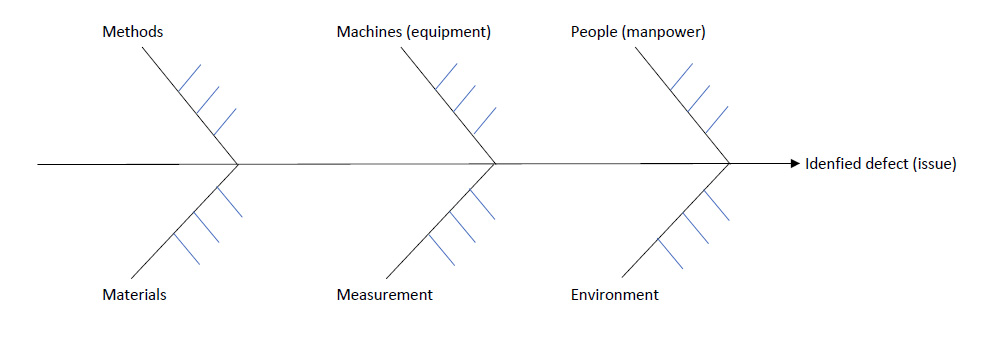
A fishbone diagram is best completed as a group effort, so many perspectives can be discussed. Many issues have many possible causes, by diagramming them out the group can contemplate more thoughtfully the given situation. View an Excel based Fishbone Diagram template (xls) that may be useful.
Affinity Diagram
Affinity diagramming is a group-based brainstorming technique that allows large numbers of ideas to be classified into groups for review and analysis. First, a large collection of ideas are generated. Then, those ideas as categorized into groups. The groupings are adjusted until all items have been addressed. Affinity diagrams help categorize large amounts of information. They also are helpful in making connections between ideas and can be used to identify themes. One way to make affinity diagrams is to use sticky notes for each idea which can then be moved around.
The first step in creating an affinity diagram is to develop a problem statement that is being addressed and write it so it is visible to all. This clearly identifies the issue and ensures ideas relate direclty. Brainistorming then occurs and ideas are generated. As with all brainstorming, this should not be limited. You may end up with 100 or more ideas but that is fine. The nex step is to start grouping the ideas into categories. In some cases the grouping is done silently at first by each group member to ensure group think (influencing each others decisions) or voicing judgement does not occur. The next step is to get consensus on the categorizations. Once the categorizations are finalized ensure a copy is retained via photographs or transfer of the information to a software program such as Visio, LucidChart, or open access mind mapping software such as WiseMapping.

Pareto Chart
Project Management Quality Management discusses Pareto charts, but they are also used in process management issue identification.
Multivoting (Nominal group technique)
Multivoting provides a means of reducing a large list of options to a smaller list of the best options or top priorities. With this technique, a group is formed that contains approximately ten stakeholders. The group starts by privately and silently listing on paper what each individual sees as likely risks. The facilitator then lists each idea on a blackboard or whiteboard. The group then ranks the ideas in order of importance. One method frequently used is to give each team member a set number of votes (such as half the total number of items on the list). Each member then votes individually on what they see as the highest priority. Their votes can be divided however they see fit (speading the votes or using multiple votes on a single item). All of the votes are then compiled and the items with the top number of votes are selected. These top votes are then discussed and prioritized.